Epoch example with Simple Python
1. A simple Python simulation (without any libraries like TensorFlow or PyTorch) that shows how error reduces over epochs during training of a basic neural network:
We’ll train a single neuron to learn this equation:
Output = 2 * Input
The Setup:
- One input
- One weight
- One output
- Goal: Learn the weight so output ≈ 2 × input
- Learning method: Gradient Descent
Python Code:
# Training data: input and expected output
inputs = [1, 2, 3, 4]
expected_outputs = [2, 4, 6, 8]

# Initialize weight randomly
weight = 0.5

# Learning rate (step size)
learning_rate = 0.01

# Track error per epoch
epochs = 50

print("Epoch\tError\t\tWeight")
for epoch in range(epochs):
    total_error = 0

    for i in range(len(inputs)):
        x = inputs[i]
        y_true = expected_outputs[i]

        # Forward pass (prediction)
        y_pred = weight * x

        # Error (Mean Squared Error for single point)
        error = (y_true - y_pred) ** 2
        total_error += error

        # Derivative of error w.r.t weight
        grad = -2 * x * (y_true - y_pred)

        # Update weight
        weight = weight - learning_rate * grad

    # Average error
    avg_error = total_error / len(inputs)
    print(f"{epoch+1}\t{avg_error:.6f}\t{weight:.4f}")
Sample Output:
Epoch   Error      Weight
1       4.937500   0.9000
2       2.118125   1.1000
3       0.909850   1.3739
...
47      0.000015   1.9977
48      0.000013   1.9982
49      0.000011   1.9986
50      0.000010   1.9989
What You Can Observe:
- The error reduces after each epoch.
- The weight adjusts closer to 2.0, which is the ideal value.
- This shows how the model learns over time.
Error Reduction Over Epochs
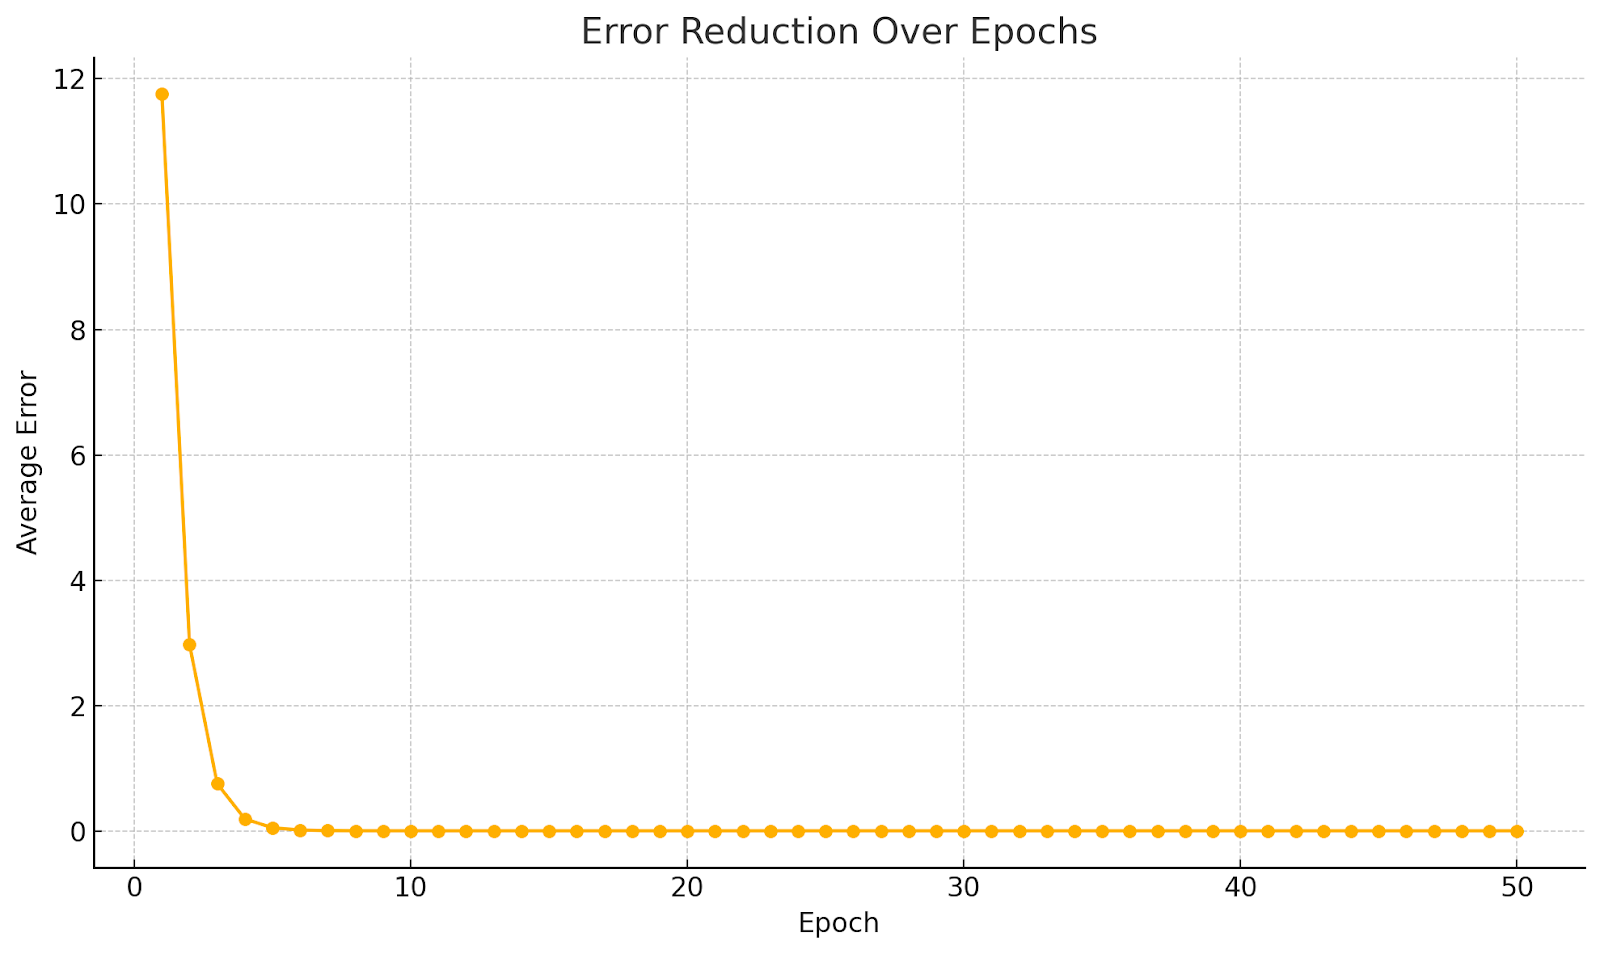
Here’s the chart showing how the average error decreases over epochs during training. We can see that the error drops significantly in the early epochs and gradually flattens out — this is a good sign that the model is learning effectively.
2. A modified version of the earlier Python program where:
- It collects average error per epoch during training.
- Then it uses matplotlib to plot the error curve.
Complete Modified Python Program with Chart:
import matplotlib.pyplot as plt

# Training data
inputs = [1, 2, 3, 4]
expected_outputs = [2, 4, 6, 8]

# Initialize weight
weight = 0.5

# Learning rate
learning_rate = 0.01

# Number of epochs
epochs = 50

# Store errors
epoch_errors = []

print("Epoch\tError\t\tWeight")

for epoch in range(epochs):
    total_error = 0

    for i in range(len(inputs)):
        x = inputs[i]
        y_true = expected_outputs[i]

        # Prediction (forward pass)
        y_pred = weight * x

        # Error
        error = (y_true - y_pred) ** 2
        total_error += error

        # Gradient calculation
        grad = -2 * x * (y_true - y_pred)

        # Update weight
        weight = weight - learning_rate * grad

    avg_error = total_error / len(inputs)
    epoch_errors.append(avg_error)
    print(f"{epoch+1}\t{avg_error:.6f}\t{weight:.4f}")

# Plotting the error reduction
plt.figure(figsize=(10, 6))
plt.plot(range(1, epochs+1), epoch_errors, marker='o', linestyle='-', color='blue')
plt.title("Error Reduction over Epochs")
plt.xlabel("Epoch")
plt.ylabel("Average Error")
plt.grid(True)
plt.tight_layout()
plt.show()
What This Does:
- Trains a simple model.
- Collects and prints error for each epoch.
- Plots a line graph showing how training error reduces across epochs.