Sobel Pattern Detection with Simple Python
Here’s a Python + NumPy example applying the Sobel operator to a small grayscale image matrix, without using external image libraries (like OpenCV). We’ll simulate a small image and manually apply Sobel filters.
Example: Sobel Filter in NumPy
1 2 3 4 5 6 7 8 9 10 11 12 13 14 15 16 17 18 19 20 21 22 23 24 25 26 27 28 29 30 31 32 33 34 35 36 37 38 39 40 41 42 43 44 45 46 47 48 49 | import numpy as npimport matplotlib.pyplot as pltfrom scipy.ndimage import convolve# Small 7x7 simulated grayscale image (brighter vertical edge in middle)image = np.array([ [10, 10, 10, 100, 100, 100, 100], [10, 10, 10, 100, 100, 100, 100], [10, 10, 10, 100, 100, 100, 100], [10, 10, 10, 100, 100, 100, 100], [10, 10, 10, 100, 100, 100, 100], [10, 10, 10, 100, 100, 100, 100], [10, 10, 10, 100, 100, 100, 100],], dtype=np.float32)# Sobel kernelssobel_x = np.array([ [-1, 0, 1], [-2, 0, 2], [-1, 0, 1]], dtype=np.float32)sobel_y = np.array([ [-1, -2, -1], [ 0, 0, 0], [ 1, 2, 1]], dtype=np.float32)# Apply convolution (Sobel edge detection)Gx = convolve(image, sobel_x)Gy = convolve(image, sobel_y)# Gradient magnitudeG = np.sqrt(Gx**2 + Gy**2)# Plottingfig, axs = plt.subplots(1, 4, figsize=(14, 4))axs[0].imshow(image, cmap='gray')axs[0].set_title('Original Image')axs[1].imshow(Gx, cmap='gray')axs[1].set_title('Sobel-X (Vertical Edges)')axs[2].imshow(Gy, cmap='gray')axs[2].set_title('Sobel-Y (Horizontal Edges)')axs[3].imshow(G, cmap='gray')axs[3].set_title('Gradient Magnitude')for ax in axs: ax.axis('off')plt.tight_layout()plt.show() |
Output Description:
- Sobel-X will clearly highlight the vertical edge where pixel values change from 10 to 100.
- Sobel-Y will be relatively dark since there’s little horizontal edge.
- Gradient Magnitude combines both.
Input image and sobel applied image
Gradient Magnitude
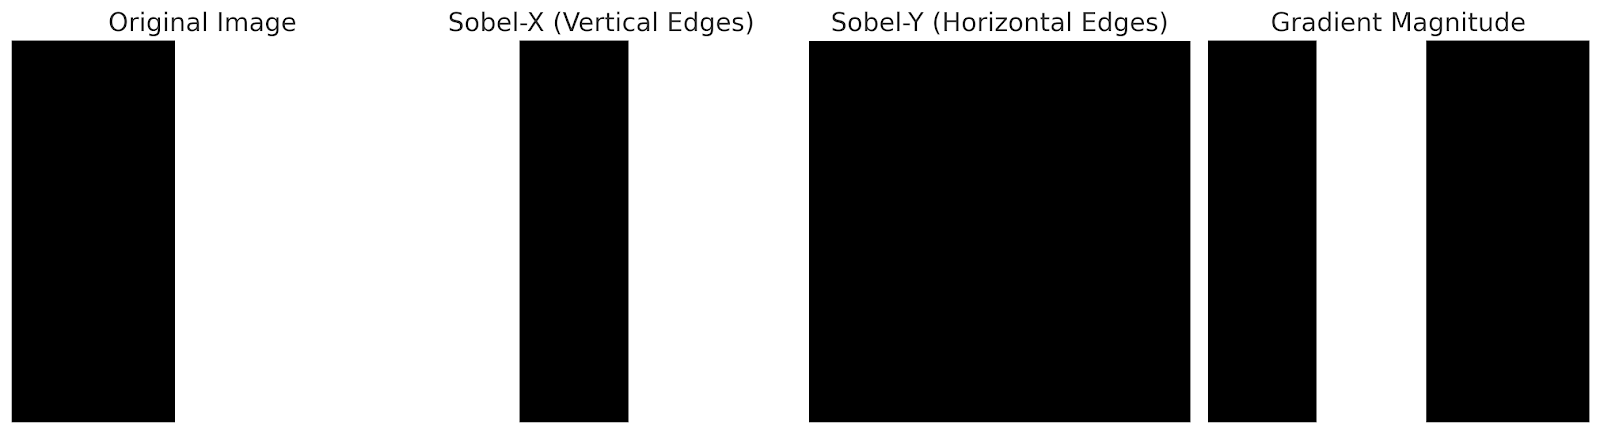
Here’s the visualization:
- Original Image: A simple grayscale image with a vertical intensity change (left side dark, right side bright).
- Sobel-X: Highlights the vertical edges clearly where intensity shifts from dark to bright.
- Sobel-Y: Barely detects horizontal changes since the image is uniform in that direction.
- Gradient Magnitude: Combines both to show the overall edge strength.
Next – Laplacian Pattern Detection